
Hilton Head Real Estate Market Report: What the Numbers Actually Mean for You
The Hilton Head housing market in February 2026 looks very different depending on what you are buying, selling, or watching.
Some segments are moving fast. Others are sitting longer than they were a year ago. Affordability has improved significantly, luxury demand is holding strong, and condo prices have shifted in ways that deserve a closer look. If you are trying to make a smart decision based on the current market, reading the headlines is not enough. The details are where the real picture lives.
This post breaks down all 12 key questions from the February 2026 Hilton Head Market Report and translates each data point into plain language so you can understand exactly what the market is doing and what it means for your goals.
Affordability and Pricing: The Numbers That Affect Every Buyer
Affordability Has Improved Significantly
The affordability index rose 27.6% year over year, climbing from 58 to 74. That is a meaningful shift. It reflects a combination of modest income growth and slight softening in some price segments, giving more buyers a realistic path into the market than they had a year ago.
The Mid-Range Sweet Spot
The $250,001 to $350,000 price range led all segments with a 28.2% increase in pending sales. This is where buyer demand is most concentrated right now, and it signals strong competition for well-priced properties in that range.
Condo Prices Dropped Sharply
Condo median prices dropped 32.5% to $337,500. The data does not point to a single cause, but for buyers who have been priced out of the condo market or who have been on the fence, this shift creates a genuine window of opportunity worth exploring.
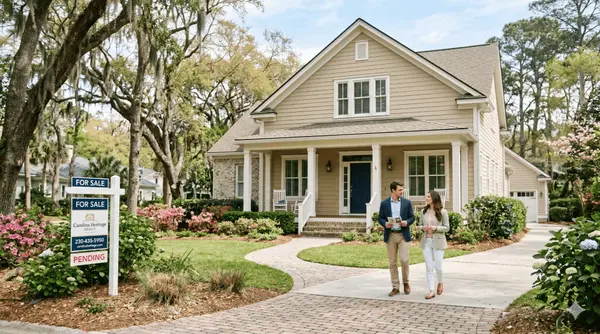
Sellers Are Still Getting Strong Offers
Sellers received an average of 96.8% of list price, just 1.0% below last year's figure. That is a small decline and still represents a strong negotiating position for sellers who price accurately from the start.
Sales Activity and Inventory: What Is Moving and What Is Not
The sales picture in February is one of selective momentum. Some property types are gaining traction while others require more patience.
Here is how sales activity broke down by property type:
- 4+ bedroom homes led all categories with a 14.6% increase in pending sales, the strongest growth of any bedroom segment
- 3-bedroom homes saw pending sales rise 6.8% and closed sales grow 3.2%, though days on market surged 83.3%
- Single-family homes led inventory growth with a 5.7% gain year over year
- Single-family homes also sold faster than condos, averaging 104 days on market compared to 109 days for condos
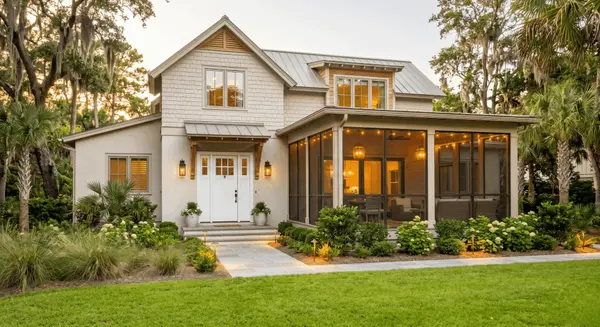
The takeaway for sellers is clear. Larger homes and single-family properties are generating the most buyer interest right now. If you are listing a 4-bedroom home in the Lowcountry, the demand is there.
Market Speed and Luxury: Where the Competitive Edge Lives
Homes Are Taking Longer Overall
Days on market jumped 116.1% overall, rising from 62 to 134 days. That is a dramatic shift on paper, but context matters. This increase is largely a normalization after an unusually fast market in prior years. Homes are still selling. They are simply taking longer than the compressed timelines buyers and sellers grew accustomed to.
One Price Range Is the Exception
The $750,001 to $1,000,000 range bucked the trend entirely, averaging just 88 days on market, the fastest of any price segment. Buyers in this range are active and decisive, making it the most competitive segment outside of the luxury tier.
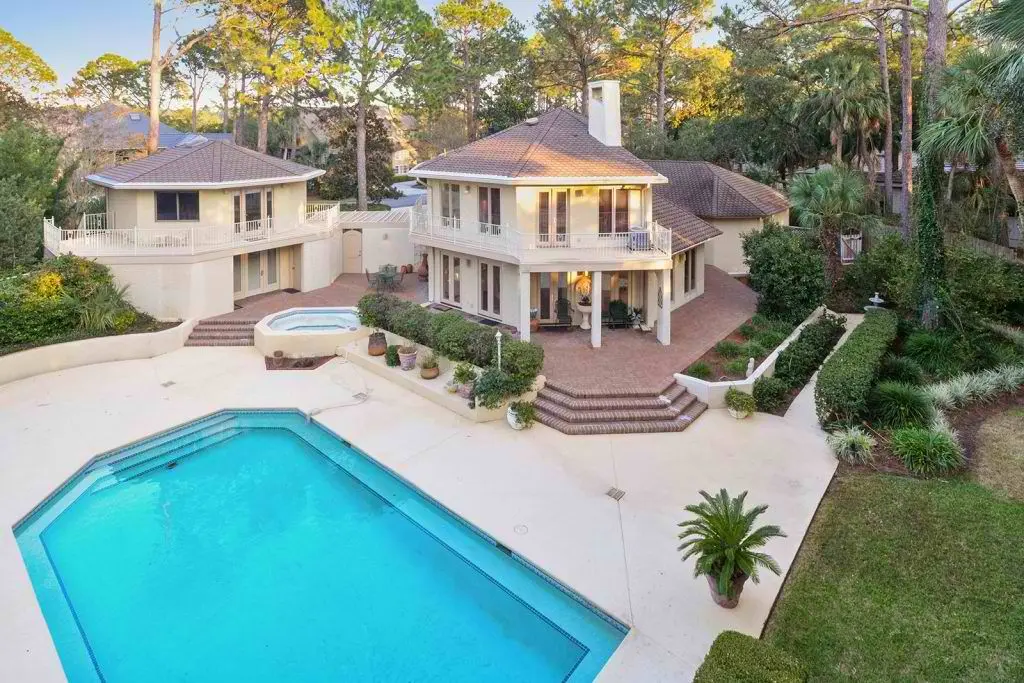
The Luxury Market Remains Strong
Closed sales on properties above $1,000,000 rose 10.8% year over year. Days on market did increase 58.5% in this segment, but with only a 4.7-month supply, inventory remains tight relative to demand. For luxury buyers, that means less selection and more competition for the best properties. For luxury sellers, it means serious buyers are still actively in the market.
Key luxury market signals to keep in mind:
- Closed sales up 10.8%, confirming genuine transaction volume, not just activity
- Supply at 4.7 months, below the 6-month threshold that typically indicates a balanced market
- Days on market rising but demand outpacing inventory growth overall
Ready to Make a Move in the Hilton Head Market?
Whether you are a buyer looking for the right entry point or a seller wondering how today's numbers affect your property's value, the data above is just the starting point. What matters most is how it applies to your specific situation.
Reach out to Loni for a private conversation about what February's market report means for your goals in Hilton Head Island and the Lowcountry.
Recent Posts